


The Race to Limit Ptrace


As our R&D team develops Rezilion, they occasionally see opportunities to improve and inform the status quo. In this post, our Team Lead, Yuri Shafet, spends some time diving into ptrace — what it is, how to use it to inject arbitrary code into a running process, how to limit ptrace execution and different techniques to dynamically detect it.
ptrace() is a system call (in place since kernel 1.0) that provides a means by which one process (the “tracer”) may observe and control the execution of another process (the “tracee”).
ptrace is usually used for debugging. For example, GDB debugger uses ptrace to attach to the debugged process and if necessary change registers or other data. ptrace is also used for tracing purposes. For example, the strace utility uses ptrace to halt the program being traced each time it calls a system call. Using strace is one of the legitimate ways to use ptrace in production.
Because ptrace allows control over processes, it also has malicious uses and was used in several real-world attacks and exploitations. For example:
- The DirtyCow bug exploitation
- CVE-2011-4327, where ptrace allowed local users to obtain sensitive key information.
- Pupy is a remote access trojan that uses ptrace. It was used in an attack on European electricity organization’s email server.
For a broader context, these findings are despite a 24% increase in annual spending on prevention, detection, and remediation of vulnerabilities from 2018 to 2019. With this in mind, it’s easy to understand why vulnerability management and patching have become board-level discussions.
To demonstrate ptrace injection in action, we perform dynamic injection of arbitrary code in the running process. To keep the code short and simple we do not check for all errors. When you write a production tool you most definitely should check for all errors. The shellcode that we are going to inject is a bind shell at port 4444. Source code of the shellcode can be found here.

Let’s compile the program and execute the attack on the running process. We will inject our shellcode into the running sleep process.
Victim process:

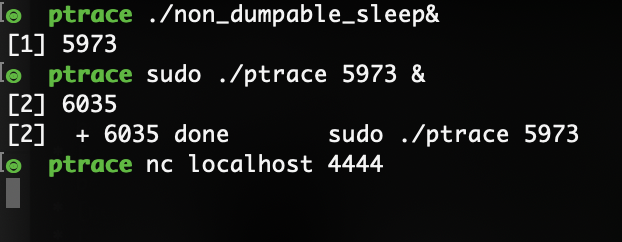
Attacker process:

Success. We’ve injected our shellcode into the target process.
Disabling ptrace in production
Disabling or constraining ptrace system calls in production environments is considered good practice. In this section we present some ways to limit ptrace execution.
Prctl
One of the ways to restrict ptrace is to use the prctl system call. We can set PR_SET_DUMPABLE (since Linux 2.3.20) flag to zero, making the process not dumpable.
Processes that are not dumpable can not be attached via ptrace PTRACE_ATTACH.
Consider the following program that sets PR_SET_DUMPABLE flag to zero and then sleeps for 60 seconds:

If we try to use ptrace to attach to the process, ptrace will fail:

However, this flag will *not* prevent ptrace usage if it is executed by root.

A real-world example of this technique used for constraining ptrace is openssh.
As can be seen in the source code of openssh, prctl is used to set PR_SET_DUMPABLE to zero.

ptrace_scope
You can apply ptrace policy via yama configuration. Yama is a Linux Security Module that collects system-wide DAC security protections that are not handled by the core kernel itself. To see current ptrace scope in the system run following command:
cat /proc/sys/kernel/yama/ptrace_scope
Possible values are:
0 – classic ptrace permissions: almost no restrictions.
1 – restricted ptrace: a process must have a predefined relationship with the inferior it wants to call PTRACE_ATTACH on. By default, this relationship is that of only its descendants when the above classic criteria is also met.
2 – admin-only attach: only processes with CAP_SYS_PTRACE may use ptrace with PTRACE_ATTACH, or through children calling PTRACE_TRACEME.
3 – no attach: no processes may use ptrace with PTRACE_ATTACH nor via PTRACE_TRACEME. Once set, this sysctl value cannot be changed.
The documentation of the configuration available here.
For example, if ptrace scope is configured runningrunning injection without root permissions will fail, as seen in the screenshot below:

However, if we change ptrace_scope (root is required to do that), we can execute ptrace injection without root privilege:

Disabling ptrace in docker
If you run docker version lower than 19.03 or have kernel version lower than 4.8, ptrace is disabled by default. You can enable it by adding –cap-add=SYS_PTRACE flag. For example {docker run –cap-add=SYS_PTRACE python}. Docker uses seccomp configuration to prevent ptrace from running. Seccomp is an efficient way to whitelist syscalls by application.
For example, when user run your docker without –cap-add=SYS_PTRACE, the injection will fail (I already have the injection program in the container):

However, when you allow ptrace in container…
![]()
Injection works as expected:

You can find in detail how –cap-add=SYS_PTRACE flag in docker works here
Tracing itself
The process can trace itself with PTRACE_TRACEME to prevent other processes from tracing it. This technique works because at any given moment the process can have only one trace. It is used in some cases as an anti-debug technique by malware. To demonstrate, let’s write a small program that traces itself and sleeps for 60 seconds:

Now let’s try to inject the shellcode with our injector.
Our program failed because the process is already traced. This technique is sometimes used by malware to prevent dynamic debugging.
Detecting ptrace
Let’s review some ways in which ptrace system call execution can be dynamically detected in the system.
/proc/[PID]/status
One of the ways to detect if a process is traced is to read /proc/[PID]/status. It provides much of the information in /proc/[pid]/stat and /proc/[pid]/statm in a format that’s easier for humans to parse. In particular, we are interested in the TracerPid field which shows us PID of process tracing this process (0 if not being traced).
For example when reading /proc/[PID]/status of an untraced process:

TracerPid is 0, meaning the process is not traced.
But when we read /proc/[PID]/status of the traced process:

Hmmm… TracerPid is still 0, because our injection is very fast and we detach from the process, before reading /proc/[PID]/status. Lets add sleep(10) before detaching part of our injection code and rerun the injection. We will also have to add #include <unistd.h> to import the sleep function:

And now TracerPid is the PID of the injector process. By running this example, we can conclude that if /proc/[PID]/status scanning has periodic nature, we may lose fast ptrace injections. To counter this we can use hook based approaches.
Process Events Connector
Netlink is used to transfer information between the kernel and user-space/kernel processes. It consists of a standard sockets-based interface for user space processes and an internal kernel API for kernel modules. We use a process events connector protocol to detect ptrace system calls. Connector protocol can dynamically trace the following events:
- Fork
- Exec
- Exit
- Core dump
- Proc comm field change
- Clone
- ptrace
- UID change
- SID change
ptrace is what we need. forkstat is an existing tool that uses the netlink protocol for tracing. It also enriches the mined events from /proc and other sources. Let’s run forkstat with an option that allows the user to trace only ptrace events:

Now let’s execute the injection:

Forkstat output:

We have here both ATTACH and DETACH ptrace events, however, POKE_TEXT and other types of ptrace are not mined. As can be seen in the source code of forkstat const bool attach = (proc_ev->event_data.ptrace.tracer_pid != 0);, detach event is generated when tracer pid is zero. We already saw that tracer pid is becoming zero after DETACH is called.
BPF
BPF is an in-kernel virtual machine which can be used for system tracing. It is an extremely powerful linux feature that allows the user to trace kernel and user space. Linux started support for bpf system call from kernel 3.18. For tracing ptrace we will use bpftrace. It is a high-level tracing language for BPF available in recent Linux kernels (4.x).
Let’s run a bpftrace tracer that detects all ptrace system calls:
![]()
The program stops when the user presses ctrl+c. Our one-liner prints the process name for every ptrace system call that the process executes. This tracer instruments tracepoints to achieve the desired functionality. Alternatively, we could use kprobes, but while kprobes allow us to instrument arbitrary kernel functions it is less stable, so if possible, tracepoints are preferred. You can read here more about different linux tracing systems.
Let’s run the injection and see what we get…

Tracer output:

We see that ptrace syscall was executed many times which makes sense because our one-liner catches all types of ptrace, including PTRACE_ATTACH, PTRACE_GETREGS, PTRACE_POKETEXT (which happens many times in our injection) and PTRACE_DETACH. To resolve that issue, we can modify our tracer to detect only specific types of the ptrace syscalls. This time we write bpftrace code in a separate file:

This program will only print events when ptrace with PTRACE_ATTACH event is executed:

As you can see for a single attack, the program printed only a single line, because PTRACE_ATTACH was executed only once.
We hope you found this post useful, and that you learned about ptrace and some of its usages — including how to disable and dynamically detect it. We highly recommend disabling ptrace in production environments, because malicious actors can instrument it for injection attacks. If you find it is necessary for ptrace to be enabled, constrain it as much as possible and if feasible add a dynamic ptrace detection mechanism.
