Monitoring in Post Production


*This is part of an ongoing series from Rezilion titled Enlightened Engineering: Reflections From Rezilion’s Tech Team
By: Mier Tapiro, Cloud Engineering Team Leader, Rezilion

Our lives revolve around measuring things on a daily basis. Comparisons between today and yesterday, between different resources – a bevy of factors. On average, a person makes about 35,000 decisions a day, and many of these require comparison tools to make the right decision.
Technological advances today are faster than ever, and as a result, devices and other assets are rapidly improving. Without comparing these technologies, devices, or resources, we can mistakenly choose the least relevant option.
The wrong choice can result in financial waste or even damage the product, creating availability problems that can be very difficult to resolve.
In this post, I’ll cover the monitoring aspects post deployment:
- Bug wise – why you should use proactive monitoring to catch bugs in production
- Performance wise – how to use a minimum amount of resources with maximum performance, using monitoring
- Security wise – how to keep you safe from yesterday’s vulnerabilities today
Post Production – Monitoring, Monitoring and Monitoring Again

Bug Monitoring
Without a system that monitors production environments, we’re basically blind.
In the old days, where we would install our product on the client’s servers, we had to be passive and wait for feedback. The environment was owned by the customer and we didn’t have access to it. Because of this, it was impossible to monitor and know what was really going on. At least, until there was a problem and the customer shared the logs from their environment.
For the cloud world this is an outdated approach.
In the cloud, where almost everything is accessible to both customer and developer, we can be proactive and monitor 24/7.
For a start, there should be a system that reads all the relevant logs from the cloud into one system. One that allows us to search and customize alerts, filtering in – aka a centralize log.
Centralize logs support in-depth log collection and analysis, and uses machine-learning and predictive analytics to simplify the process of finding critical events and data generated by cloud resources.
Coralogix and logz.io are good examples, but there are more.
Performance
In the cloud world, we want a system that can monitor all the resources we have and alert us to performance issues.
If we look at AWS cloud components, for example – we would have a system that monitors the amount of messages in queues (e.g. SQS) or S3 buckets. This defines a rule that actually warns if the trend of the messages only grows with time and the queues are not enough to clean it up.
We may also want to check the cpu and memory status. For example, if cpu usage is larger than 65%, we’ll want to notify and even increase it automatically. Of course, this also has financial implications that need to be taken into account. The same goes for memory.
We may also want to measure the IOPS on resources that we do a lot of read and write operations on, as they can be bottlenecks.
Our target should be – a system with the minimum amount of resources and maximum performance.
So, if we do not measure, we won’t know the status, cost, and performance of our environment.
We also won’t know if we can add more customers to the system, nor what needs to be improved to add more customers.
The conclusion – in order to maximize performance and minimize expense we need measurement tools. Tools which will help make the right decision based on relevant data and not based on educated guesses.
A good start could be to use the monitoring system of the same cloud where your system is running.
For example in AWS, through CloudWatch you can create a dashboard with all kinds of metrics that interest us. You can even set customized rules.
Most centralized log tools also come with a dashboard system that allows you to measure and monitor your cloud environment.
Each of these tools have pros and cons. I personally found a tool in Grafana that is very useful for the purpose of monitoring.
A mostly free tool, Grafana can read logs from AWS, Elasticsearch, Coralogix, and many other data sources. So, you can easily get a dashboard that captures information from many sources easily and quickly.
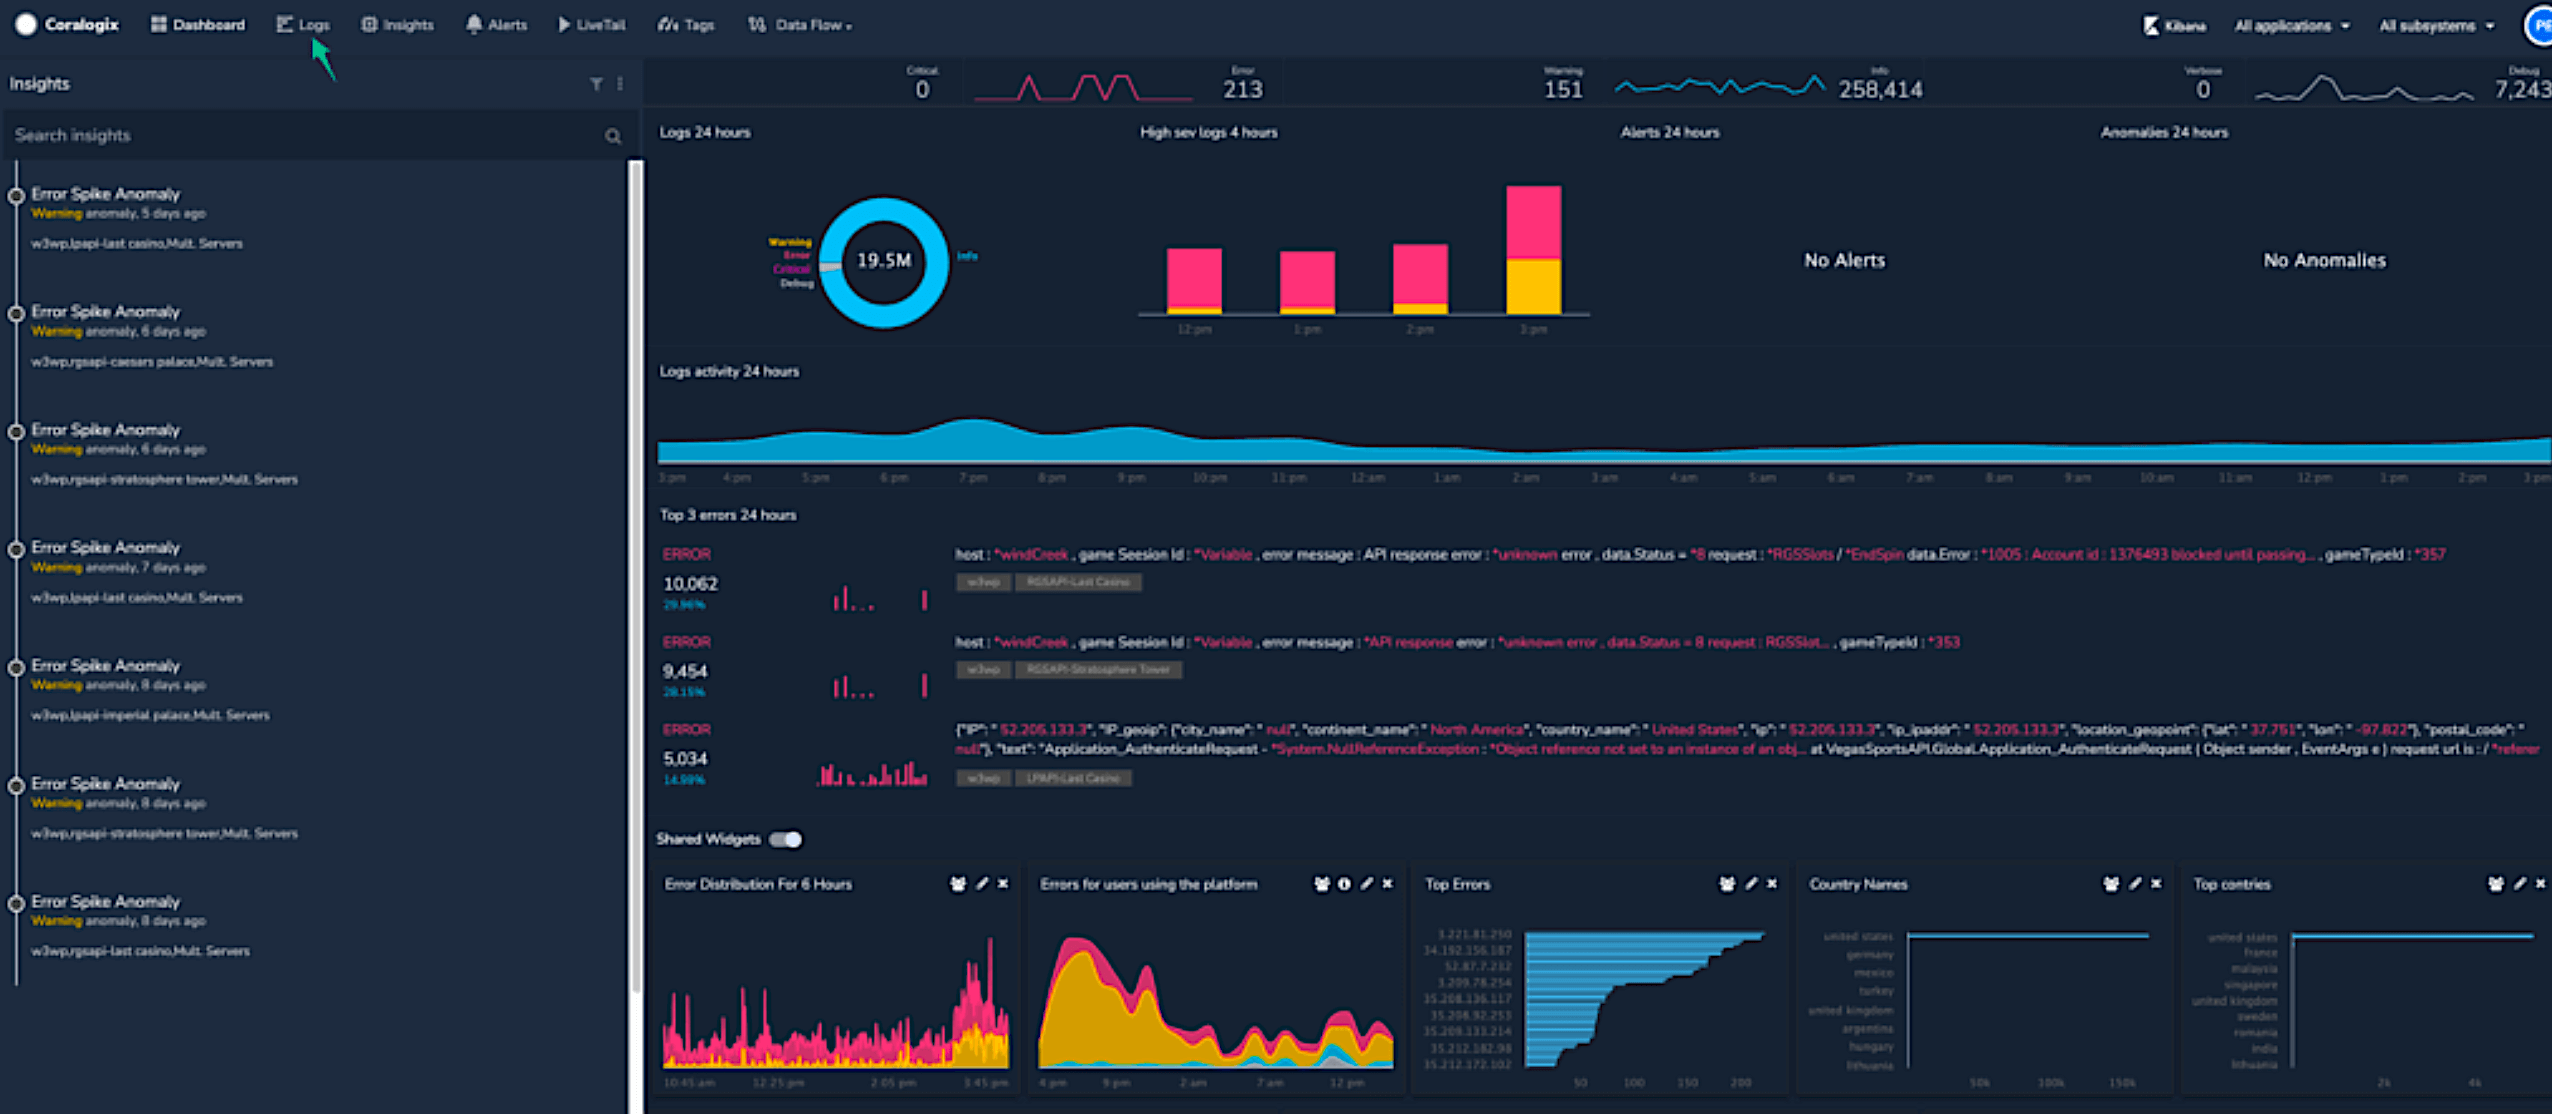
Here’s an example of the Grafana dashboard:

Security
The importance of security protection has risen sharply in the last few years. Organizations and companies small or large, hi-tech or low-tech, are showing a growing interest in the issue of infrastructure protection.
In 2020, we saw a number of significant acquisitions in the cyber field, such as the acquisition of Siemplify by Google for about $ 500 million, or the sale of Guardicore to Akamai for about $ 600 million.
The number of cyber attacks has grown steadily over the last few years. In 2016, 758 million malicious attacks occurred according to Kaspersky Lab. That means an attack launched every 40 seconds!
The cost of cybercrime damages in 2019 was $2.1 trillion, in 2021 it hit $6 trillion.
The average MTTD (Mean-Time-to-Detect), according to the 2017 Ponemon Cost of Data Breach Study, was 191 days with a range of 24 to 546 days. Just think what a hacker can do to your environment in this time, how much information they can steal.
Organizations face a troubling threat landscape like never before, and you hear about new massive data breaches almost monthly. Organizations’ ever-expanding digital footprint and supply chains are also factors adding to this risk, which cyber criminals are aware of and willing to exploit.
In the cloud world, the cloud vendor (AWS, Azure, GCP) takes care of securing its resources and specifies its area of responsibility.
“…AWS data protection services provide encryption and key management and threat detection that continuously monitors and protects your accounts and workloads. … AWS identifies threats by continuously monitoring the network activity and account behavior within your cloud environment…” (www.amazon.com → security)
Who (And How) Do We Protect the Components We Upload to the Cloud?
Our code, the packages and the open source we are using, the images that are running on the EC2 machines – who protects them?
More than that, there are organizations and governments that are only willing to do business with vendors who stand with security compliance and regulators, and maintain very high security on their process and products.
Therefore, another layer of protection should be an active layer – there should be a system that regularly and over time monitors the vulnerabilities it has on every resource or machine it uses.
Such a system should analyze the existing threats, quantity, on what code/package the vulnerability is found, and what the severity is. Then, offer the weighted score for all resources or the most common containers with the most severe vulnerability.
More sophisticated systems can give a recommendation on how to download and fix the vulnerability.
Data breaches that go on for months are a result of poor detection and response capabilities.
The Desired Monitoring System
Identifying threats as soon as possible is key in today’s threat landscape. Continuous monitoring can take your security detection, along with your response capabilities, to the next level. This helps you offload the tedious task of filtering through hundreds and even thousands of alerts.
Monitoring tools should include a dashboard with all the information needed to understand the attack surface, as well as metrics that will help to easily and quickly understand what the security status is.
For example – a list of all hosts and images, and the extent of vulnerability on each of them. Including in which specific package the problem is, whether there is an update available for download, a trend graph that shows whether we are accumulating more threats over time, whether we are dealing with them and the extent of vulnerability is decreasing, division of hosts by amount of threats, hardware, etc.
The system Rezilion offers meets these criteria exactly.
A system that monitors all hosts and images running inside on the client side. It compares the results against the known vulnerabilities, presents the client with all existing threats, and makes the client’s attack surface accessible to the organization.

The bonus Rezilion offers is to reduce the amount of alerts (by about 70%), by only alerting on packages that are loaded to memory and building your attack surface according to this information – as code that is not loaded into memory cannot be attacked through it.